DFS Strategy: Optimal Points Per Dollar

 Navigating any large-field daily fantasy football tournament is challenging, with minefields at every turn. When it comes to a monster field of 200,000 or more, such as the DraftKings Millionaire Maker, the number of obstacles that must be dodged are magnified, but the potential rewards are unmatched.
Now that we’ve competed 13 weeks of the NFL season, we have a pretty good idea of what it actually will take to reel in the largest barracuda in the DFS ocean. The invaluable tool of winning lineup deconstruction can present us with a roadmap showing what we should be looking to accomplish when constructing our rosters.
You will often hear DFS players talk about “getting 5x value;” this is a measure of the number of fantasy points a player returned in relation to their salary. When a player scores 20 fantasy points, if his salary was 4,000, then he returned 5x value (or $5 per/$1,000 of salary).
A DFS player will look at what the winning team totals tend to be for a given tournament, and dividing this total by the salary allocated, will say that his team needs to hit “4x or 5x value,” whatever the case may be, in order to have a realistic shot at winning that tournament.
With the 13-week body of work to dissect, we have gone through the winning Millionaire Maker lineups in an attempt to find what has actually been needed to win at each position in terms of value. We are looking for a sweet spot at each position that can be used as a guideline in setting rosters for future weeks.
First we will look at what the winning scores have been to date:

The average score to take down the Milly in 2015 has been 253.18. When we eliminate the high score and the low score, the number is a virtually unchanged 253.67. Using the $50,000 salary cap, we see that across the nine rostered positions, we are going to need to gun for five points per $1,000 dollar of salary. Let’s dig a little deeper and take a look at how this 5x is breaking down by position, starting with
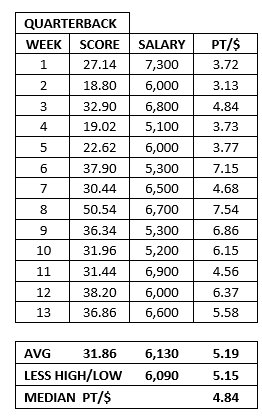
The sweet spot for our QB looks to be a salary of 6,100 and a return of about 5.17x, which is just slightly above the overall winning score average of 5.06x. Even taking out the Brees Week 8 explosion and the Mariota Week 2 lowball number, our goal return is unchanged.
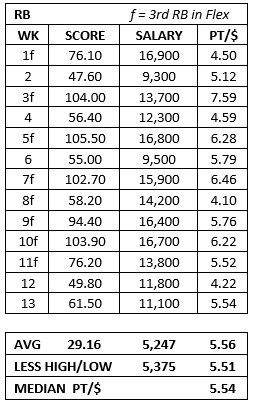
The analysis of both Running Backs and Wide Receivers presents additional factors. They are multiple roster spot positons and one or the other is usually a flex play. The eight weeks in which a RB has been flexed is indicated by an f next to the week number. With the RB position, we see a sweet spot at 5,300 salary and a return of about 5.53x. In other words, the RB position is where the winning lineups have gotten more for less when measured against QB, finding value of 0.36x greater than at the QB position on a salary that’s $800 lower.
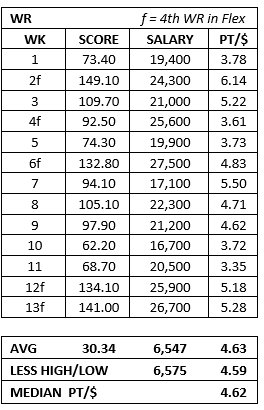
Wide receiver is a three roster spot position on DK and a flex WR was used on five occasions this season. Our WR sweet spot is $6,560 salary with a 4.60x return, so winning players have found more wiggle room at WR than at RB, using $1,260 more of salary to come up with 0.93x less production. Two studs and a value cheapie?
[IMGART]http://www.pocketfives.com/profiles/admin/albums/article-images/593186-tight-end.jpg[IMGART]
At tight end, we have needed to milk 5.63x out of 4,845 of salary to hit our sweet spot, showing this to be the real make or break position.

Our sweet spot on defense is in the $3,070 neighborhood, with a return of 5.28x.
In summary, it is one thing to have a ballpark idea of what your squad will need to score, but by using the model of the previous winners, we can get a clearer picture of what to spend where and what will be needed from each spot’s contribution to the puzzle.


